Here, I will explain you how to create custom territories in Tableau 10, and how it is different compared to Tableau 9.
Here, I am using "Sample – Superstore (Sample - Superstore.xls)" as data source.
Just have a look at below table for "State wise Sales" information.
State wise Sales (Excel Pivot Table) 
|
State wise Sales (Tableau Map View ) 
|
Create Custom Territories using Groups in Tableau 10
Step 1. Connect to "Sample Superstore Excel data source", and create "State wise Sales" filled map view.
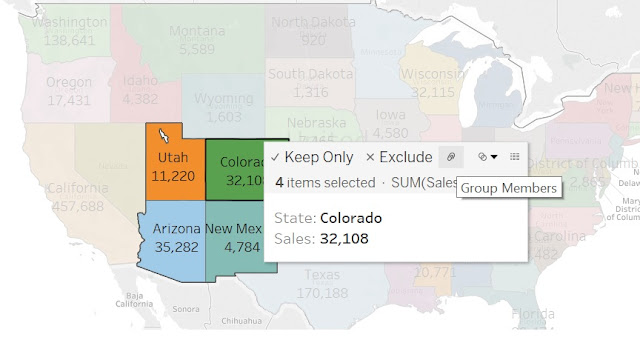
Step 2. Create a group by selecting multiple states and click on "Grouping icon" in the above map view as shown in below snapshot.
Then, view will become like this
Step 3. Now, remove 'State' field from Label & Detail; Drag and drop 'State (group)' on to Label & Detail;
See the output below. Now you can see all the 4 states with a combined border.
If you perform the above steps in Tableau Desktop 9, below is the output.
Happy coding!!!


No comments:
Post a Comment